Powered by PEI-Dispatch - Hourly electricity dispatch model for PEI
PEI 2025-2040 8760h/yr
Electrify PEI
Can PEI's electricity system support a net-zero future?
Prince Edward Island's Net-zero Carbon Act commits the province to achieving net-zero greenhouse gas emissions by 2040. Electrify PEI uses PEI-Dispatch, an open hourly electricity model, to explore what that could mean for PEI's electric grid.
Using real PEI electricity demand, weather, wind, and solar data, the model simulates every hour of the year to examine how electrification, renewable energy, energy storage, imports, exports, and curtailment interact.
What the model finds
In the 2040 scenario:
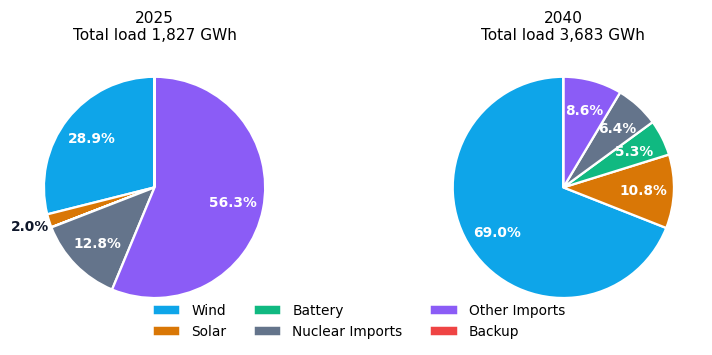
85% local renewable power — 91% clean power including nuclear imports
Average load grows from about 209 MW in 2025 to about 420 MW in 2040 — roughly a doubling
438 hours straight on 100% clean power
259 hours — May 27, 8am to Jun 7, 2am — also on 100% clean, with battery 3.7%
It does not prove net-zero is easy. It shows a highly electrified PEI can run mostly on local wind and solar, with weeks like the one below.
438 hours straight on 100% clean power
Jun 15, 3pm – Jul 3, 8pm Atlantic. No Other Imports, no Backup. Wind 65.7% • Solar 20.4% • Nuclear 9.1% • Battery 4.8%.
Wind and solar took turns. When solar was peaking at midday, wind's share was lower. When solar went to zero at night, wind was carrying it. This time the battery actually had to work — it discharged 6,746 MWh, 4.8% of load, through the calm nights Jun 21-22 and Jun 30-Jul 3. It ends Jul 3, 9pm when wind collapses to 79 MW, solar is 0, battery is down to 211 MWh and cannot cover the 179 MW import.
So can PEI's electricity support net-zero? In 2040, electricity is 85% local renewable power — 91% clean power including nuclear imports — with weeks like this one. And this is a significant electrification — electricity is already doing a lot of transport and heating, through EVs and heat pumps.
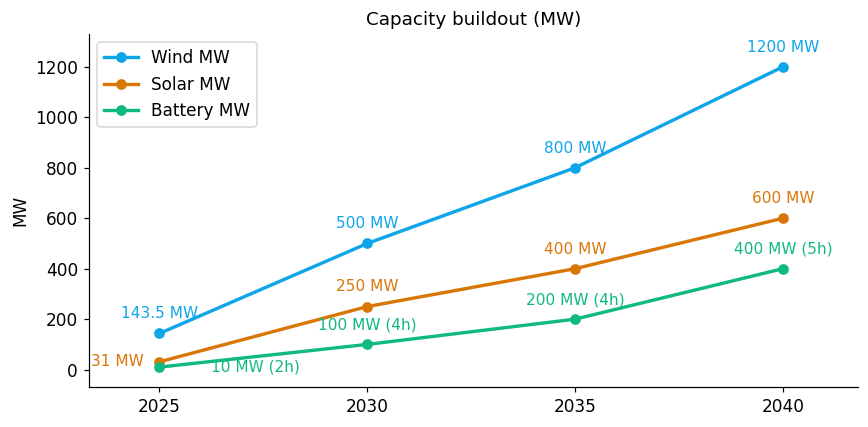
Today, PEI runs on 143.5 MW of wind, 31 MW of solar, and a 10 MW / 20 MWh battery - plus cables to New Brunswick. The 2040 scenario asks what happens if we build out to 1,200 MW of wind, 600 MW of solar, and a 400 MW / 2000 MWh battery.
Electricity demand keeps growing
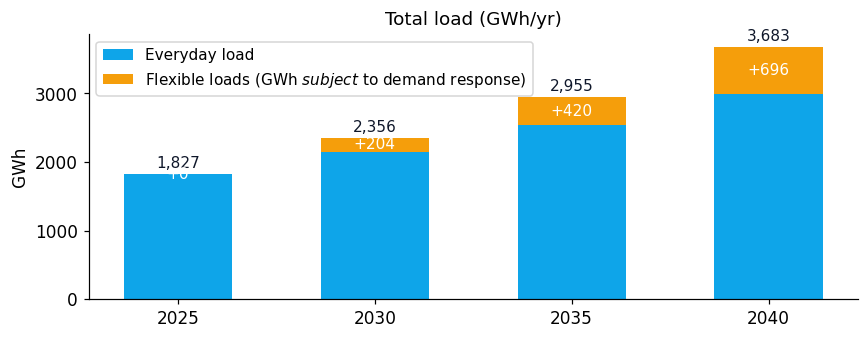
PEI's electricity use has grown 3.3% per year on average over the past eight years. The scenarios start with that same everyday growth, and then add flexible loads from 42,800 EVs, 45,000 heat pumps, and 15,000 hot-water tanks that can shift their timing. Together, total load grows faster than 3.3% - in the 2040 scenario, about 4.8% per year on average from 2025. Average load grows from about 209 MW in 2025 to about 420 MW in 2040 - roughly a doubling.
What the scenarios show
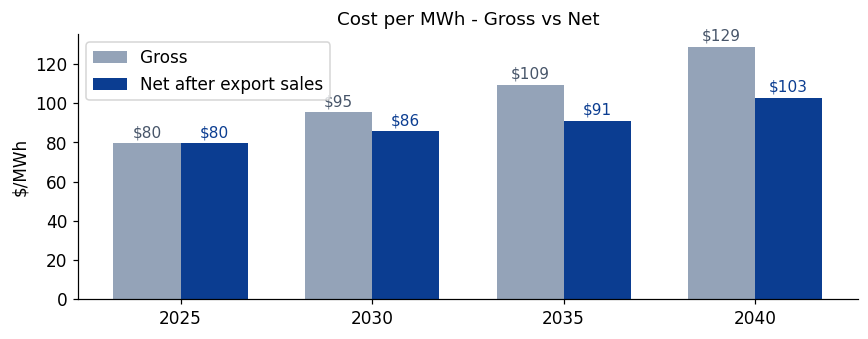
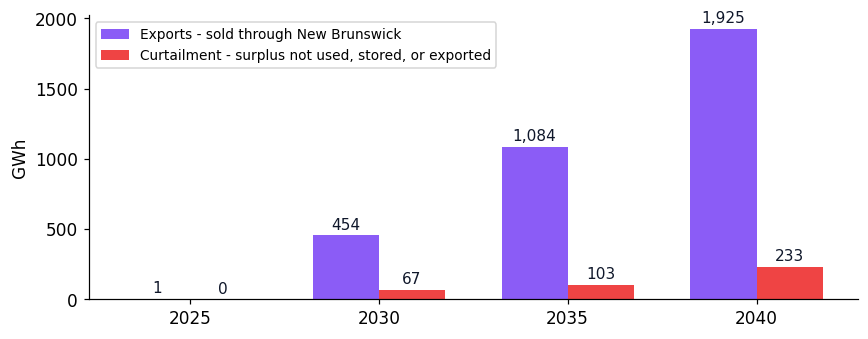
Total load - everyday load plus flexible loads. It doubles 2025-2040.Capacity buildout - total installed wind, solar, and battery capacity in each year. Battery labels show power and duration, e.g. 2040 is 400 MW (5h).As electricity demand grows due to population and electrification of transportation and heating, it doubles. Local wind, solar and batteries grow from 31% of supply in 2025 to 85% in 2040. Clean power - local plus nuclear - grows from 44% to 91%.Cost per MWh - gross cost vs net cost after export sales at $50/MWhExports and curtailment - surplus wind and solar sold through New Brunswick at $50/MWh, and surplus that could not be used, stored, or exported
Exports pay for part of the system. Surplus wind and solar are sold through New Brunswick at $50/MWh. In 2040 that is $96M of revenue, credited against system costs - so the net cost islanders pay is $103/MWh, vs $129/MWh gross.
Curtailment is the other side of that surplus. In 2040 the model curtails 233 GWh - surplus that could not be used, stored, or exported, even after exports hit the cable limit. That energy cost money to build, but delivers nothing, so at $50/MWh it is about $11.7M of export revenue that never happens. Put another way, curtailment adds about $3/MWh to the net cost: without it, net cost would be about $100/MWh instead of $103/MWh.
Two real hours in 2040
The figures above are yearly totals. These are two actual hours from the 2040 run. Times are Atlantic Time.
Cold, dark, tight
Feb 13, 1am AST — −15.7°C
PEI needs 612 MW. Wind gives 184 MW, solar 0 MW, nuclear 29 MW. The battery discharges 215 MW, down to 339 MWh left out of 2,000 MWh. Other imports still have to fill 185 MW. Exports 0 MW, curtailed 0 MW.
Sunny, windy, surplus with nowhere to go
Apr 30, 1pm ADT — 12.3°C
PEI needs only 284 MW. Wind alone could give 1,138 MW, solar 509 MW. The battery is already nearly full at 1,960 / 2,000 MWh. Exports hit the 610 MW cable limit — and still 782 MW is curtailed, surplus that could not be used, stored, or exported.
How the model works
In each hour, wind, solar and nuclear meet everyday load first. If there is surplus, flexible loads absorb it first, then the battery charges, then exports; surplus that cannot be absorbed locally or exported is curtailed. If there is a shortfall, the battery discharges first, then imports fill the rest. If imports through the cables are at capacity, on-island backup is used as a last resort.
Demand response has two modes. Most hours, flexible loads follow renewable surplus. On the coldest day, they switch to cutting the peak.
It treats PEI as one place, not street by street. The only wire it models is the cable to New Brunswick.
Prices do not decide what runs when. The model follows the fixed order above, then adds up costs afterwards using those prices. Backup is last in that order - it runs only when PEI is still short after battery and other imports, even if the cable is full.